
Your sandbox for data-driven innovation
The Playground environment is a dedicated instance of the STACKIT Data & AI Platform. Through an exclusive "sneak peek," you can test state-of-the-art data processing functionalities with zero setup effort. This gives you both insight and a basis for decision-making. You’ll experience how to apply the tools in practice and derive business value from raw data in real time. All components are built on a unified data source—secure, high-performance, and made in Europe.
The three pillars of the Playground
We rely on proven standards: Our platform seamlessly integrates powerful open-source solutions such as OpenWeb UI and Apache Superset with our proven STACKIT products Dremio and JupyterHub. While you enjoy unrestricted access to the full range of tools in our Playground, you benefit in the background from the security and independence of open-source software.
Note: The integration of JupyterHub for complex data science notebooks will follow in Q3 2026.
Dremio (Data Lakehouse) - the central data source
Here, data from a wide variety of systems is consolidated, processed, and made available as a reliable basis for analysis (single source of truth).
Superset (Business Intelligence) – the visualization tool
Turn dry tables into interactive dashboards and reports to spot trends at a glance.
OpenWeb UI (AI Assistant) – Your intelligent dialogue partner
Ask questions directly to your data in natural language. Powered by STACKIT AI Model Serving.

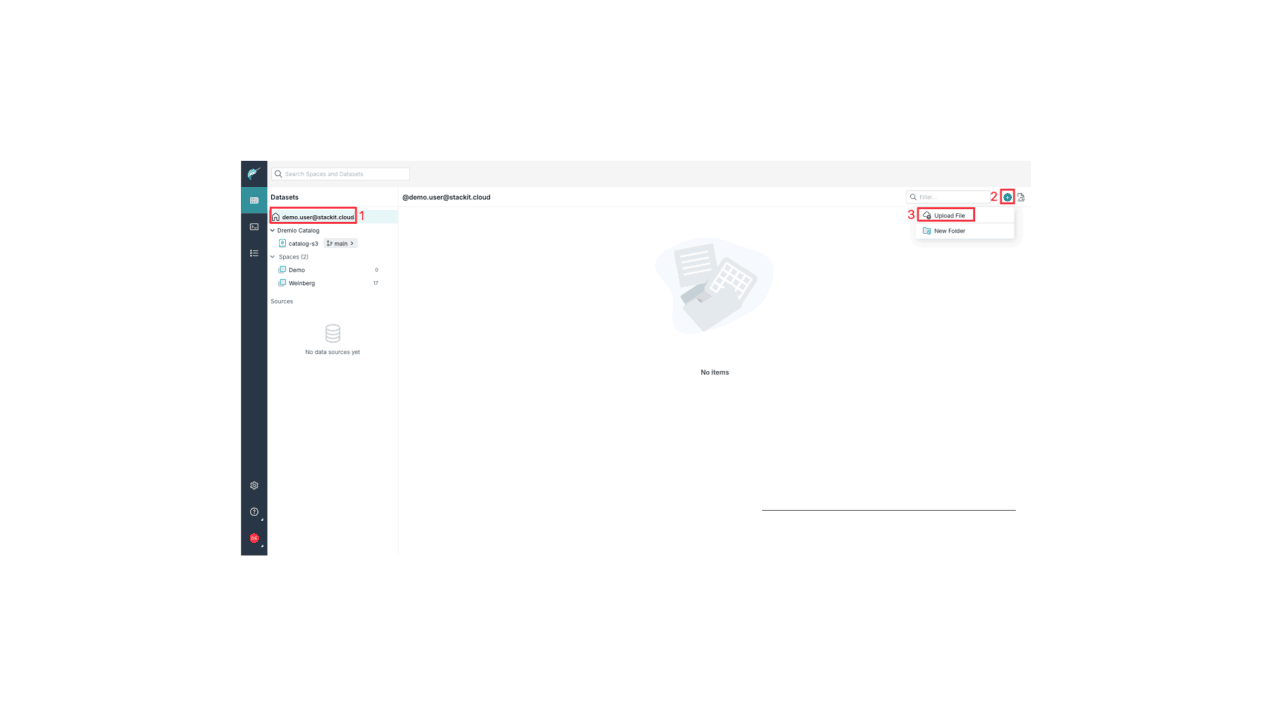
- Navigate to your home directory in the left-hand menu bar.
- Click the plus icon (+) in the top right corner and select Upload File. A new window will open.
- Upload the file via drag & drop or select it using the file browser. At the bottom, you can name the resulting file.
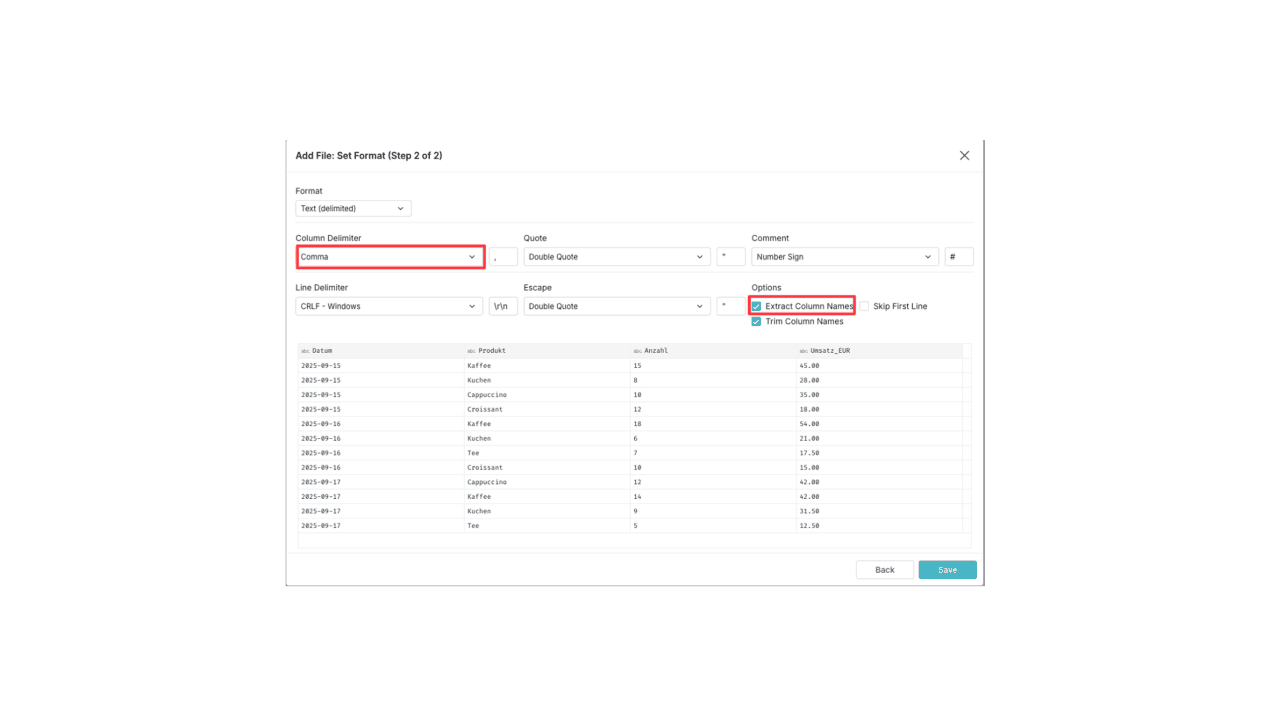
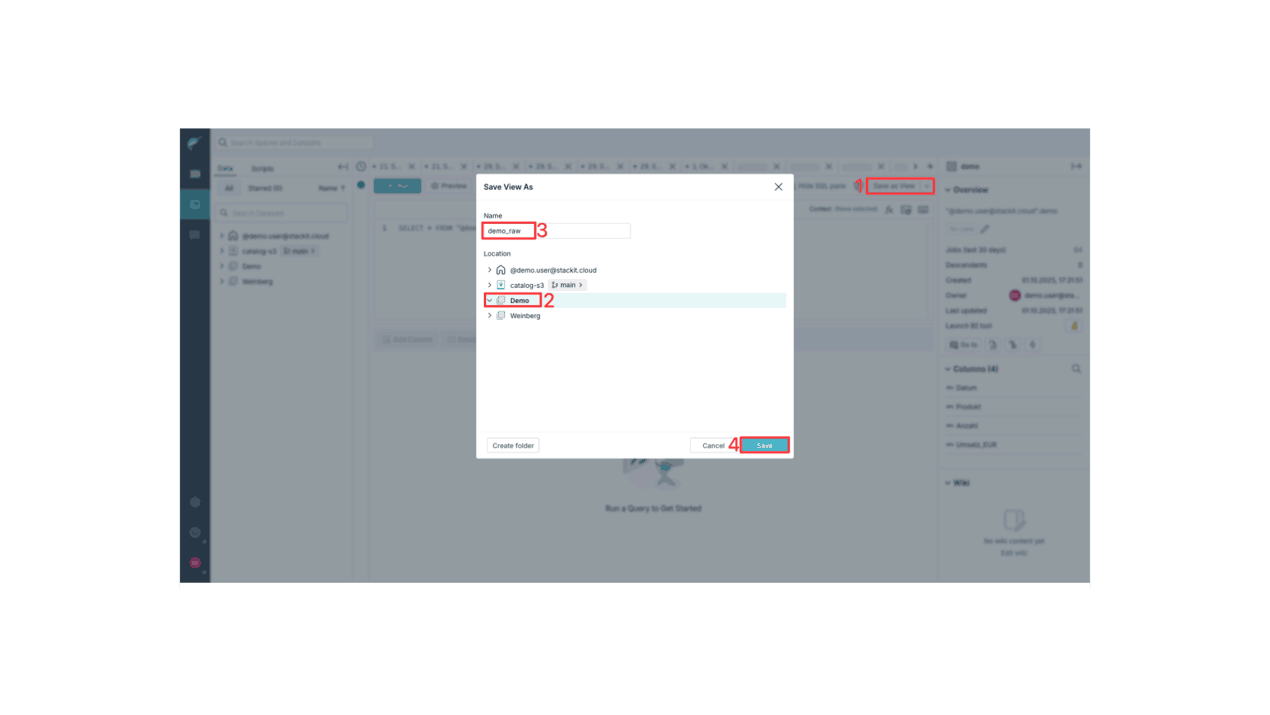
The Result
You have now created a view in a space accessible to others. This view is a direct link to the file in your home directory. Team members can now view and query the data. For simplicity, we are omitting further data refinement steps (Medallion architecture) here.
Part 2: Superset – Visualizing Data
Superset is an open-source visualization tool. You use it to create interactive reports and dashboards from the data prepared in Dremio. In this guide, we’ll connect to our demo_clean view and build our first dashboard.
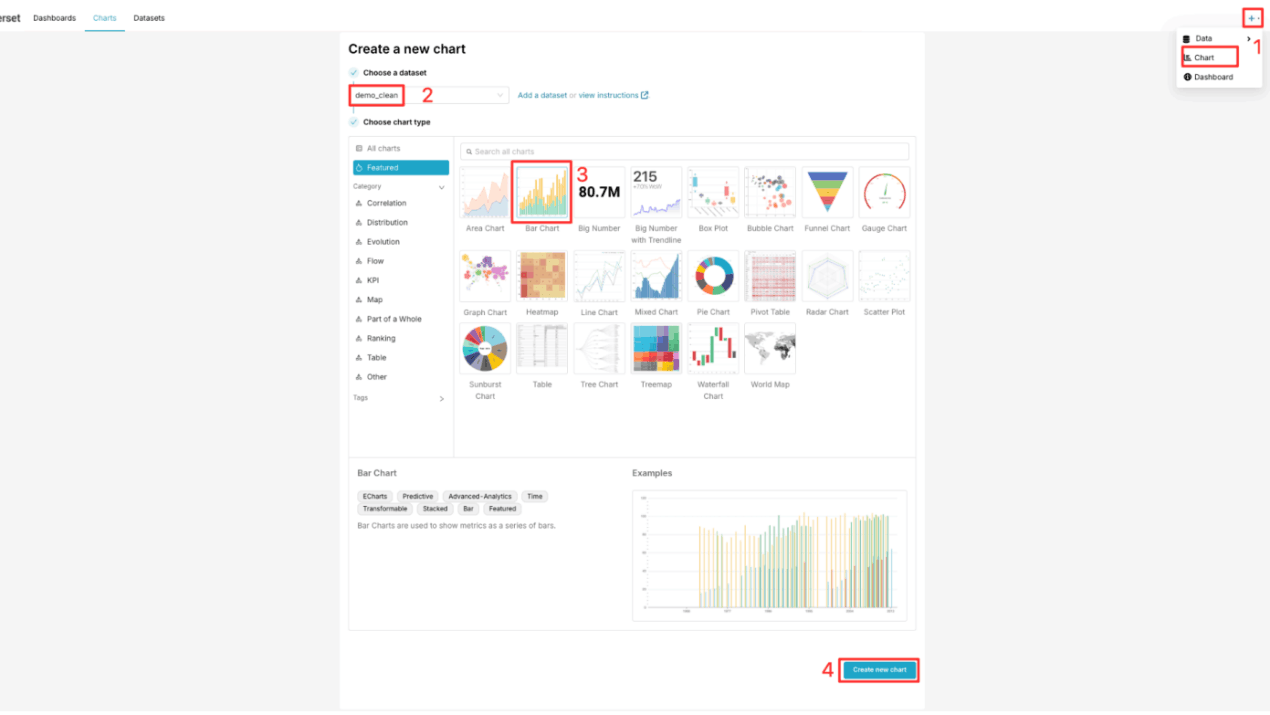
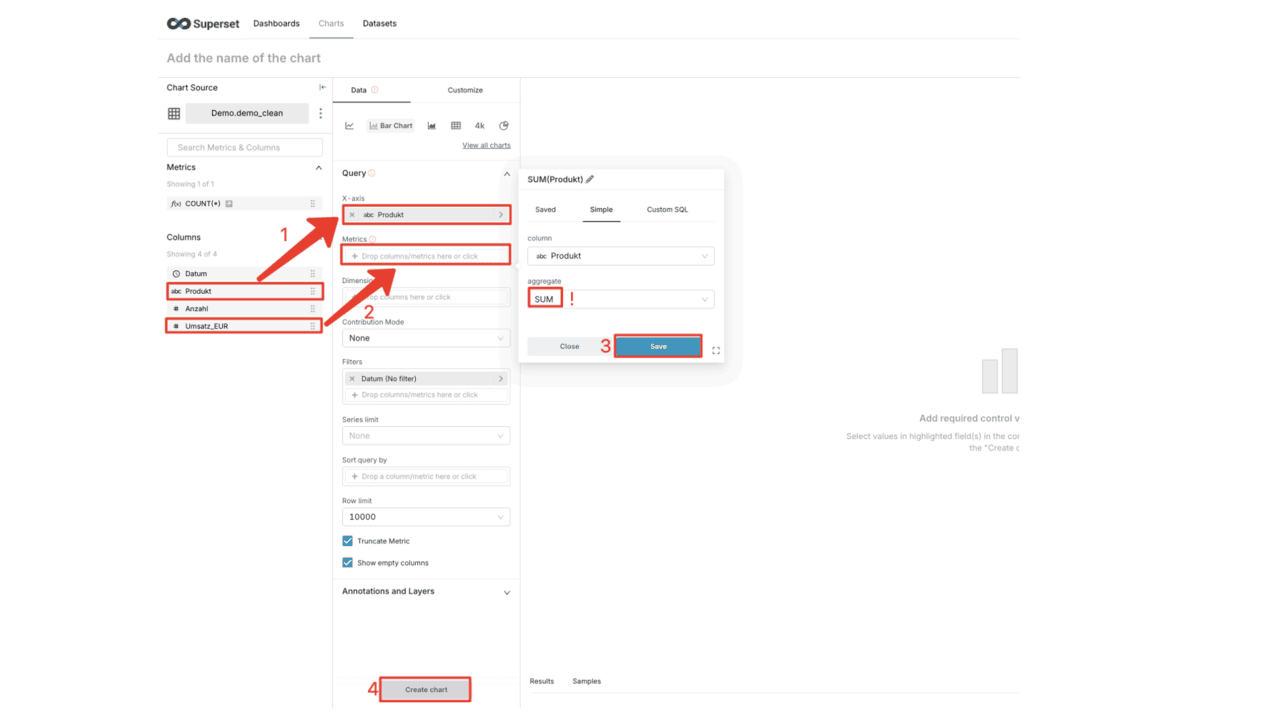
A chart is a single graph (e.g., a bar chart). We will now create a chart that shows revenue per product.
- Click the plus icon (+) in the top menu bar and select Chart.
- A new window will open. Here, select our Dremio dataset demo_clean. If the dataset does not appear immediately, you can use Add a dataset to select your connection, schema (corresponds to the Dremio Space), and table.
- Select Bar Chart as the visualization type.
- Click on CREATE NEW CHART.
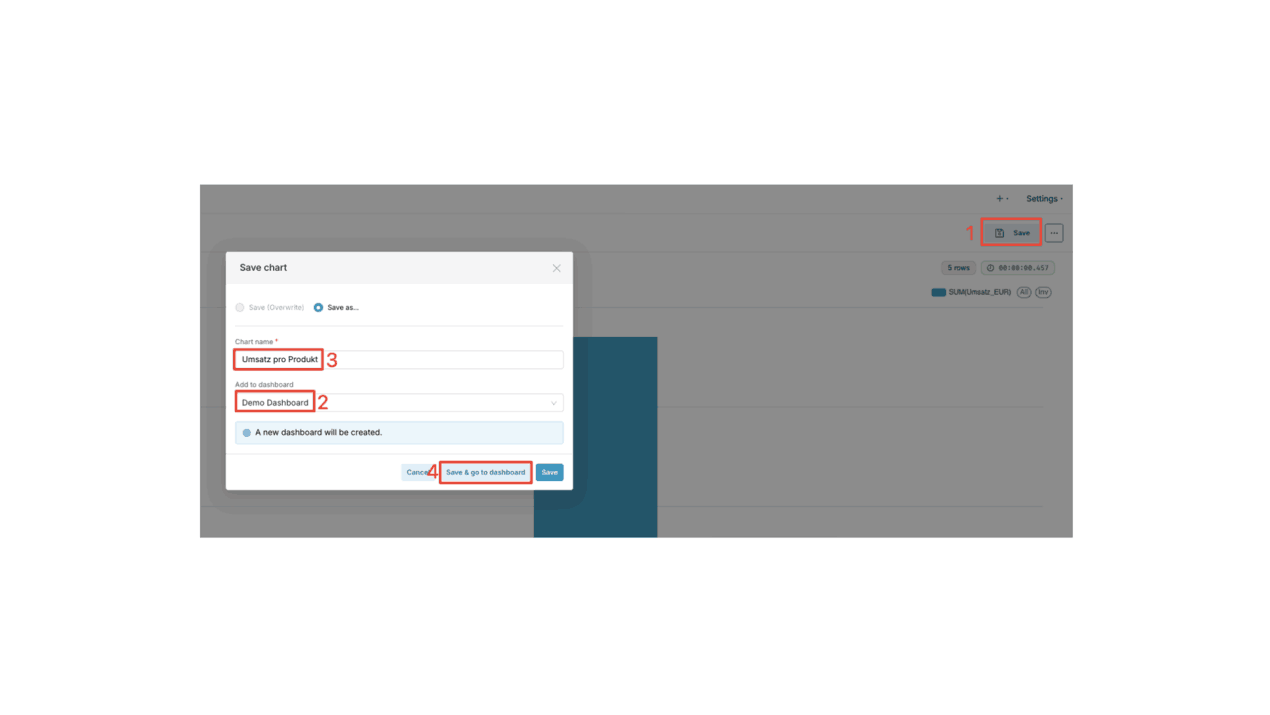
The Result
You have just created your first dashboard with a dynamic chart. If you click on Edit Dashboard in the top right corner, you can adjust the size and position of the chart on the dashboard via drag-and-drop and add additional charts using the same process.

Part 3: OpenWeb UI – Chatting with Data
Thanks to STACKIT AI Model Serving, you don’t have to write SQL. An AI model translates your questions into database queries.
Important note regarding data access: Currently, the AI model has access to the "Weinberg" demo dataset. Access to your own uploads (demo_clean) is not yet possible in this version. The following steps therefore refer to the "Weinberg" data.
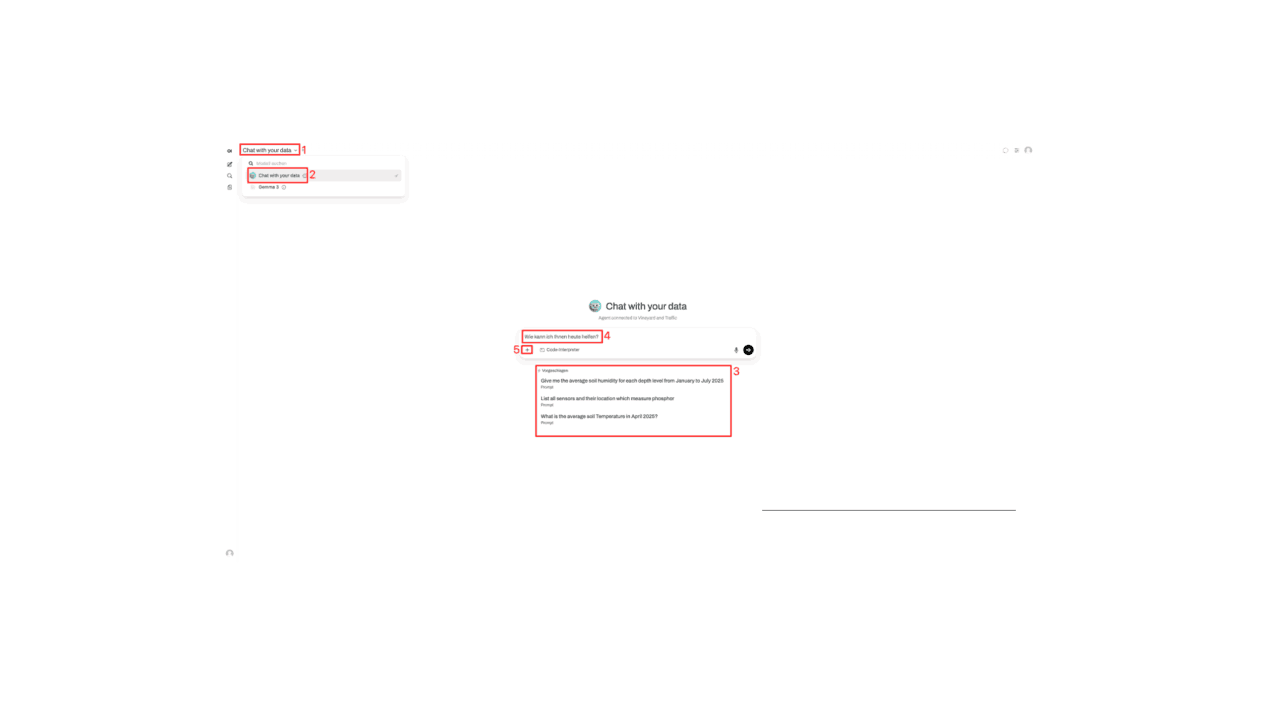
- Click the model selection dropdown menu in the upper-left corner.
- Select the Chat with your data model. Only this model is connected to our Dremio data source. General models like Gemma 3 do not have access to your specific data.
- Enter your question in plain language in the chat box in the middle. You can also get inspiration from the suggestions.
- Let’s ask our example question: What is the average ground temperature in April 2025?
- Press Enter or click the Send button. Note on file upload: Next to the text input field, you’ll find a plus symbol (+). This allows you to temporarily upload files (e.g., a CSV or text file) to ask questions directly about the content of that file. This is useful for quick, one-time analyses of files that aren’t stored in Dremio.

The result
You have successfully interacted with your data and received quick answers to your questions without having to write a single line of code or configure a chart yourself.
Get started now in the STACKIT Playground
Want to test these features yourself? Register here for your personal access to the Playground environment. Our experts will grant you access as soon as possible.
FAQs about the STACKIT Data & AI Playground
What data formats can I upload to the Playground?
You can use text-based formats such as CSV (manual configuration required) or modern self-describing formats such as Parquet (no configuration required).
What is the difference between my home directory and a space?
The home directory is your private space for experimentation. A Space is a collaborative environment where you can make data available as a “View” for your entire team.